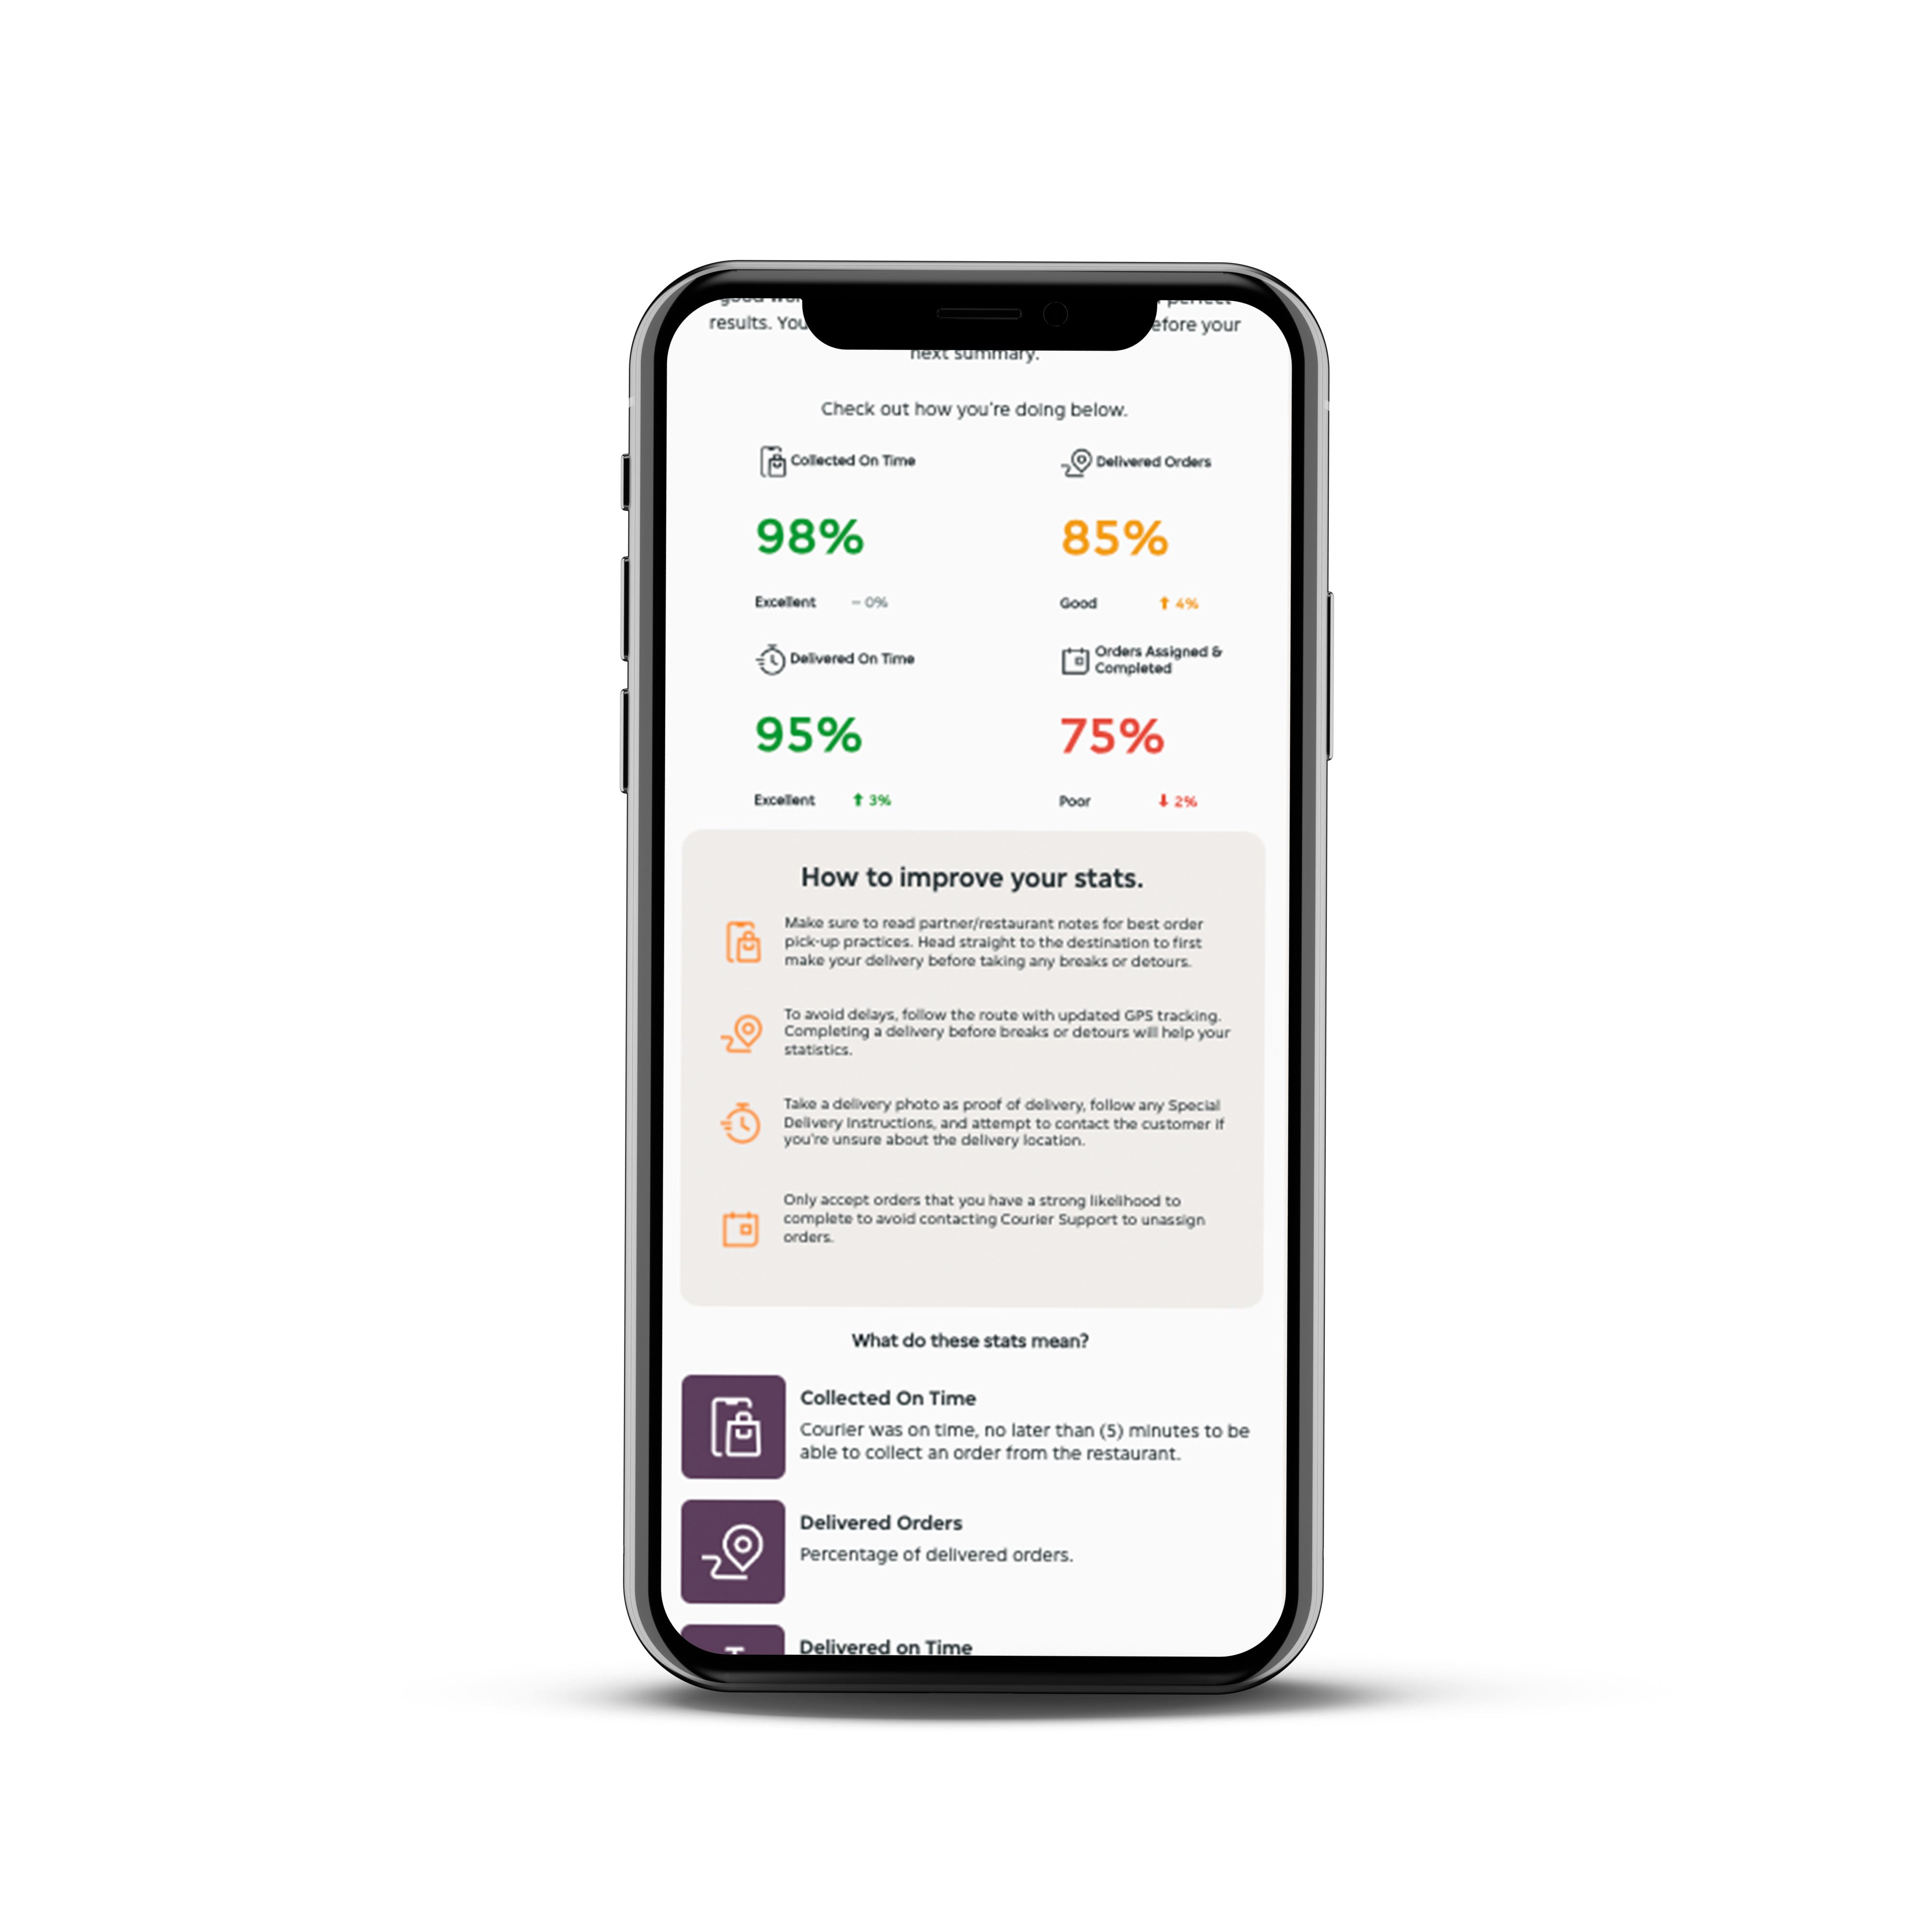
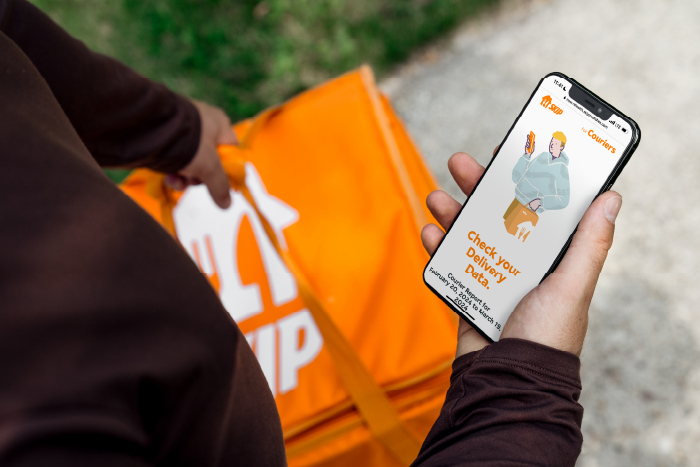
Check your progress with your courier statistics on your Delivery Data. No more guessing, you’ll get a bi-weekly email update with tips on how to improve.
Skip will use Delivery Data to improve customer experiences and ensure the highest performing couriers get access to the below (except Hamilton):
- Preferential Scheduling: Couriers with higher stats will get priority when schedules are created. Make sure to set your availability each week to take advantage!
- Priority Order Assignments: Delivery Data will help decide who gets priority during order assignment.
Boost your stats to unlock these benefits!
Check out the inside track article to learn more about preferential treatment

Definitions of stats and tips to improve your numbers.
Collected On Time: The courier arrived at the restaurant on time or early, within 5 minutes of the ETA and inside the partner geo-fence. Wait time does not affect this metric.
- TIP: Make sure to read partner/restaurant notes to ensure a smooth order handover. Heading straight to the destination can improve your stats.
Delivered on Time: The courier delivered to the customer on time or early, within 5 minutes of the ETA and inside the customer’s geo-fence. Wait time does not affect this metric.
- TIP: To avoid delays, consider if you need to make a stop before accepting an order. Heading straight to the destination can improve your stats.
Delivery Success Rate: The percentage of orders successfully delivered to customers. A delivery is considered “unsuccessful” if the customer does not receive the order.
- TIP: Take a delivery photo as proof of delivery, follow any Special Delivery Instructions, and attempt to contact the customer if you’re unsure about the delivery location.
Offers Assigned and Completed: The percentage of assigned orders the courier completed. This may drop if orders are manually unassigned or reassigned due to significant delays.
- TIP: Consider if you can actually complete an order. Accepting only orders that you have a strong likelihood to complete helps avoid chatting with Courier Support to unassign orders.
The up and down arrows you see beside the percentages indicate how your stats are trending week over week.
*At this time, Delivery Data will only be available through email. We will consider an in-app version in the future.

